

Assessing Liverpool’s statistics both in defence and attack in 2016, Andrew Beasley suggests we are well on course for a title challenge in 2017.
2016 will go down as one of the strangest years in English football history. Unfancied outsiders Leicester City won the league while the previous champions Chelsea posted the worst title defence seen in the Premier League era.
The two sides appeared to have taken part in some kind of Hollywood body-swap comedy, and while normality appears to have resumed, the Foxes breezed through their Champions League group while European veterans Spurs collapsed in Europa League.
The two Manchester clubs both hired new managers and spent over £150 million on new players yet are still waiting for significant improvements in results, and Arsenal finally won their Champions League group only to draw Bayern Munich again anyway. Plus ça change.
So what of Liverpool? The Reds may have bagged the most goals they’ve scored in a calendar year since the 1980s, but how does the overall table look for 2016?

“When’s the parade?” the cynical amongst you will say, but whilst there’s no Champions League qualification for finishing in the top four for a calendar year, I think this table is encouraging for a couple of reasons, and not least as Jurgen Klopp‘s men phoned in a few matches as the Europa League increased in importance last season so weren’t always at full strength either.
Seventy-three points from 38 games is not to be sniffed at, as Liverpool have only topped that tally five times in regular seasons in the Premier League era.
There’s also the small matter of scoring 87 goals too; aside from the remarkable 2013/14 campaign, that’s at least 10 more goals than the club have scored in every other season in the last 24 years. Yes, the goals-against figure is too high (as only eight teams conceded more than Jurgen’s Reds in 2016), but the goal difference is still impressive overall, and not too far short of what league champions often post.
Perhaps more importantly, though, particularly as we look to Liverpool to maintain a title challenge throughout the second half of 2016/17, I think the performance across the last 12 months can provide an excellent foundation for the rest of the current campaign, much like 2013 did (when the Reds took 69 points from their 37 matches) and the club last had a serious crack at winning the Premier League.
Liverpool may have finished second in the 2016 league table, but did they deserve to? After all, just four points separated second and sixth, so a piece of good or bad luck here or there might have made the table look less encouraging.
I’ve taken a look at the underlying stats from 2016 to see what they can show us about how Liverpool performed. I’ll start with a look at all shots—and please note that the figures are for all games in 2016, even though I’ve excluded the relegated and promoted teams from the tables as they haven’t played as many games.
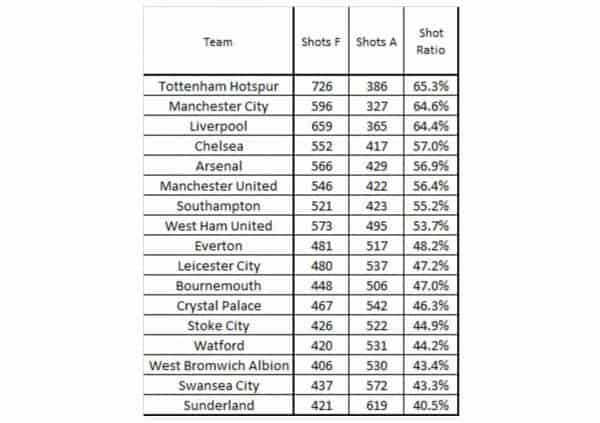
The ratios are calculated by dividing the shots-for figure by the total of the shots both for and against. It’s a definite tick for Liverpool here as they finished second at both the attacking and defensive ends of the pitch, and were only just beaten into third place when combining the figures in a ratio.
As an aside, it would appear that Crystal Palace were perhaps unfortunate to finish rock bottom of the 2016 league table, though I doubt many Reds will shed a tear for the recently axed Alan Pardew.
How do the shots-on-target figures look, again sorting the teams by their ratios?
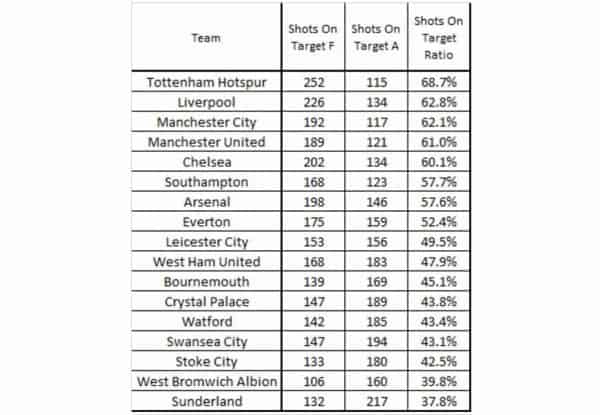
It’s another good performance by the Reds here, and as the team which finishes third in the league averages around 62 percent on this metric, they look worthy of where they’ve finished on the 2016 league table.
Credit has to go to Spurs here though; only one team (Carlo Ancelotti’s champion Chelsea side from 2009/10) has bettered a shots on target ratio of 68.7 percent in the last eight seasons, which shows just how well Mauricio Pochettino’s team performed last year.
Opta have a stat called clear-cut chances (which are also known as ‘big’ chances), and they are defined as “a situation where a player should reasonably be expected to score usually in a one-on-one scenario or from very close range.” Let’s take a look at these figures for 2016:
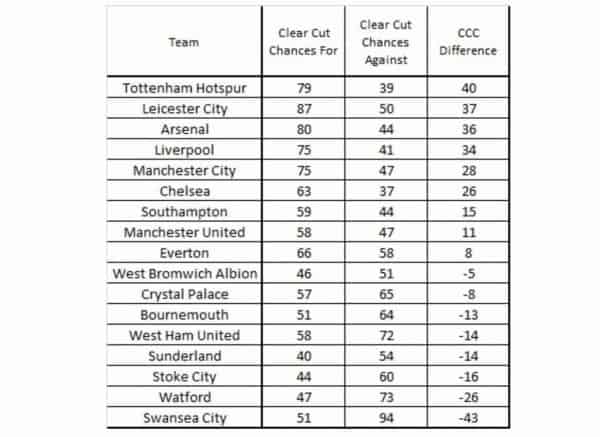
If you’ve ever wondered why Swansea repeatedly concede three goals in a game, this table will go a long way to explaining it. At the top end, it’s good to see the Reds in the top four, and their CCC difference of 34 compares favourably to their figure from 2015/16 of 16, so we can see that they’re moving in the right direction on this front.
To finish, a look at shots in the box:
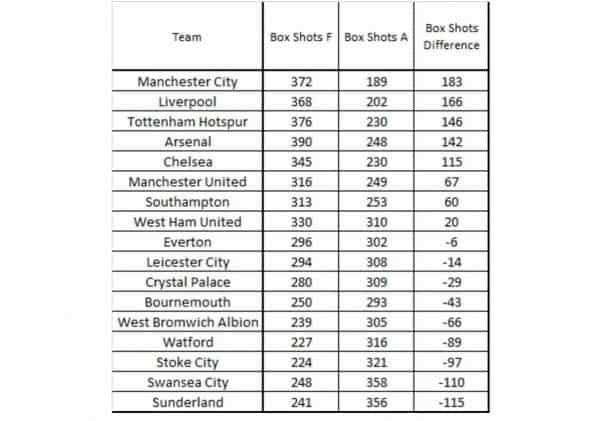
I trust you’re getting the idea by now? Yeah, Liverpool were pretty damn good in 2016. It has probably surprised a few of you to see that the Reds’ defence allowed the second-fewest shots in their box last year, but that’s exactly what happened.
The problem at the back remains that Liverpool allow too many top-quality chances for how many shots the opposition have, and we saw that in the first match of 2017 when Sunderland took a point thanks to two daft penalties.
But overall the figures show that Jurgen Klopp used his first full calendar year at Anfield to get his team in shape and on course for a title challenge in 2017.

")
")
")


")


Fan Comments