There’s a chapter in Michael Lewis’ Moneyball called ‘Giambi’s Hole’, which discusses in part how the Oakland Athletics replaced their star first baseman Jason Giambi. Lewis describes the thinking:
The A’s front office had broken down Giambi into his obvious offensive statistics – walks, singles, doubles, home runs – along with his less obvious ones – pitches seen per plate appearance, walk to strikeout ratio – and asked: which can we afford to replace?
The previous season Giambi’s on-base percentage had been .477. (The average American League on-base percentage was .334.) Jason Giambi wasn’t the only player in the Oakland A’s lineup who needed replacing. Johnny Damon (on-base percentage .324) was gone from center field, and the designated hitter Olmedo Saenz (.291) was headed for the bench. The average on-base percentage of those three players was what Billy Beane and Paul DePodesta had set out to replace. They went looking for three players who shared an ability to get on base at a rate thirty points than the average big league player.
I’ll be the first to recognise Moneyball’s limited application in football at the moment, but I’m interested in the concept of replacing players by the sum of their parts. For example, when Arsenal lost Fabregas and Nasri, could they sign players who cumulatively cover the performance hole left by those two players? It’s a far less scientific in football, but I thought I’d make some baby steps, maybe expanding the analysis on feedback.
 The central midfield of Liverpool in 2008/09 was proclaimed “the best midfield in the world” by its fans, with Alonso, Gerrard and Mascherano proving a holy trinity of sorts en route to second place in the league. The central midfield of Liverpool in 2011/12 is, on paper, more limited, with Adam, an older Gerrard, Lucas and Spearing largely filling central midfield roles.
Can the performance sum of these four players, therefore, match the performance sum of the players three seasons ago? For example, does Liverpool’s current central midfield make as many interceptions per minute as the team’s central midfield in 2008/09?
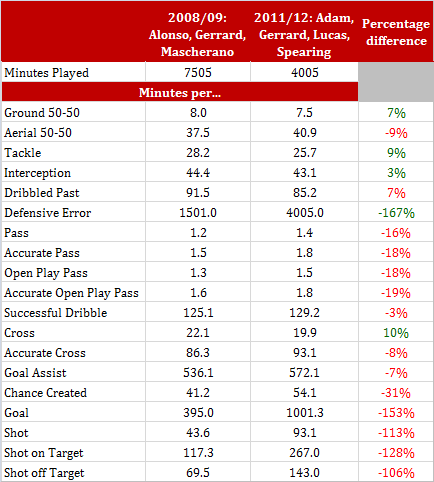
 Liverpool’s current midfield make fewer defensive errors on average, more interceptions and more tackles, but in many other performance indicators they are down on the 2008/09 trio.
For instance, a combination of Alonso, Gerrard and Mascherano took an average of 86 minutes to deliver a successful cross in 2008/09. The current selection of central midfielders take over 93 minutes.
Needless to say there are all kinds of external issues with this analysis; the opposition, rest of the team, style of play etc. I’ve also not examined individual, match-by-match line ups which might reveal biases of who plays well with which teammates. But when you see figures such as -18%, it feels like a reflection of where the current midfield is at: about 20% worse than that fantastic trio.
For the time being, these numbers are a reflection of an attempt to try something new, there’s a lot unaccounted for but hopefully it provides food for thought.
This article first appeared on EPL Index.








Fan Comments