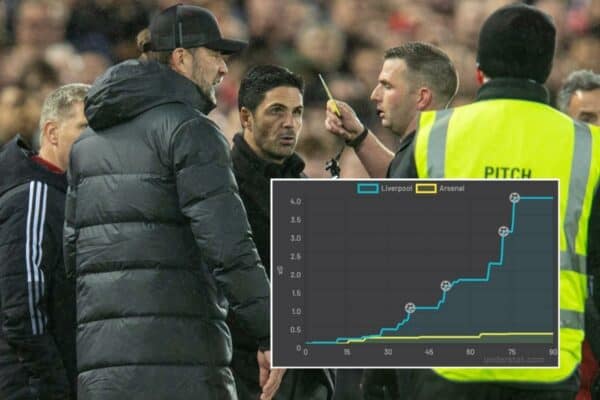
The impact of Mikel Arteta’s touchline tantrum was clear to see during Liverpool’s 4-0 thrashing of Arsenal, but put into stats it makes for even more compelling viewing.
There are times when managers can feel helpless to influence the game playing out in front of them, with Klopp frequently noting the importance of half-time.
Before that 15-minute break, coaches are often at the mercy of their pre-match plans, for better or worse, unable to change things until the referee blows his whistle.
During Saturday’s clash with Arsenal, however, Liverpool were spurred into action by a duel between the two men in the technical areas, with Arteta taking exception to a challenge from Sadio Mane.
The Spaniard was furious with Jurgen Klopp, but made a big mistake in riling up the Anfield crowd, who roared the Reds on to an overwhelming win.
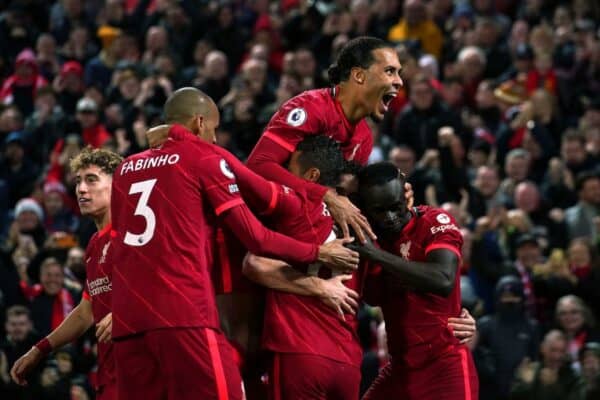
That row came in the 31st minute, and by the 39th, Mane had opened the scoring with a fine header, with further goals from Diogo Jota, Mohamed Salah and Takumi Minamino sealing the victory in the second half.
Trent Alexander-Arnold described Liverpool’s dominance as leaving Arsenal “seeing red blurs all over the place,” while Alex Oxlade-Chamberlain said it was “the turning point in terms of energy and atmosphere.”
A chart of the expected goals (xG) of both sides over the course of the game, courtesy of Understat, highlights the true impact of that incident:
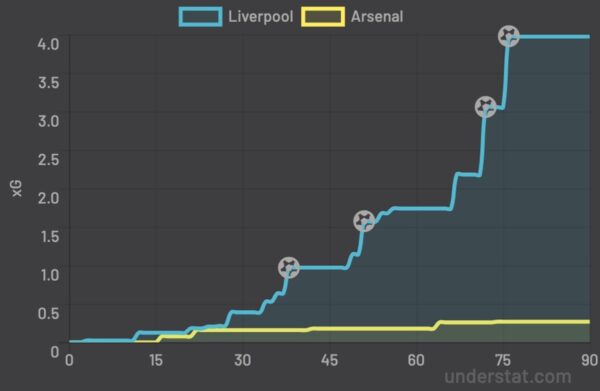
As explained by Jonny Whitmore for The Analyst, xG “measures the quality of a chance by calculating the likelihood that it will be scored from a particular position on the pitch during a particular phase of play.”
“This value is based on several factors from before the shot was taken,” Whitmore adds.
“xG is measured on a scale between zero and one, where zero represents a chance that is impossible to score and one represents a chance that a player would be expected to score every single time.”
By minute 31 at Anfield, Liverpool’s overall xG score was 0.39, and in the hour that followed, that rose to 3.97 – which, clearly, is an accurate portrayal of how the game played out.
There was a sharp rise in xG almost immediately after Arteta’s interruption, which led to yellow cards for both managers.
Liverpool barely let up afterwards, with nine of their 13 chances created coming in the hour that followed, as well as 12 of their 19 shots on goal – and, of course, all four goals.
")


")


")

")


")
Fan Comments